Ramblings
Building a monument - Master Grapher for Windows
Problem statement
Master Grapher was originally written for MS DOS by Demana, Waits and Clemens as a companion to their handbook on graphing calculators [Demana, et al, 1989]. The program was used in a computer lab that I was running as part of a mathematics upliftment program. A problem arose with certain functions, such as tan, spurious lines would be appear on the screen at points where the function flipped betwen -∞ and +∞. This confused the students, who perceived the anomaly as real and even hand waving explanations by lecturers and tutors did little to clarify what they were seeing.
Having already converted the lab's computers to remote boot Windows 3.11 systems, I felt that Master Grapher could be re-written to run under Windows. With permission from both Frank Demana and Bert Waits to use the name and maintain the familiar screen presentation, I set myself the task of doing the job.
(12 January 2026)
Solving the problem
Rewriting Master Grapher for Windows was nothing like updating a DOS program. The Windows environment required a fresh understanding of how the system fitted together—from message handling to window structures, from device contexts to the way graphics were drawn. The abstractions that Windows introduced were elegant but non-obvious, and it was easy to get lost in layers of handles, messages, and callbacks. Understanding how all these pieces worked together was essential before even attempting to write a line of code that would draw a graph correctly.
For this, I was fortunate to have Charles Petzold's book [Petzold, 1992] as my guide. Petzold's explanations of windows, messages, and the structure of the graphical subsystem were invaluable; without them, I would have been navigating blind. His work showed how windows, controls, and device contexts interacted, how painting and refreshing were coordinated, and how one could respond to user input without corrupting the program's state. In short, it illuminated the internal logic of Windows in a way that no other resource did at the time. Much of the early part of this project involved studying Petzold, experimenting with small test programs, and slowly building an internal mental model of the system—a necessary foundation for the monumental task ahead.
The computer lab was equipped with 80386sx hardware, and a primary constraint from the outset was that the program had to run comfortably on those machines. Memory and performance were not abstract concerns but daily realities. For that reason, my initial language of choice was C: the compiled programs were compact, predictable, and well suited to the hardware. It was also the language used in Charles Petzold’s examples, which made it the natural starting point for the project. Development was done using Borland’s Turbo C++ IDE (version 3.1), configured to compile plain C code.
The purchase of Turbo C++, was at my own expense rather than the university's. During development I submitted several bug reports to Borland, and in return received a complimentary copy of Borland C++ (version 4.5). I suspect this was less an act of generosity but rather a strategic attempt by Borland to establish a foothold within the university environment.
The user interface was completed remarkably quickly: the main screen was laid out, axes could be drawn and scaling behaved as expected. This, however, was the easy part. The real work still lay ahead - first in writing a parser for the mathematical syntax, and then in the truly monumental task of turning user input into reliable graphs.
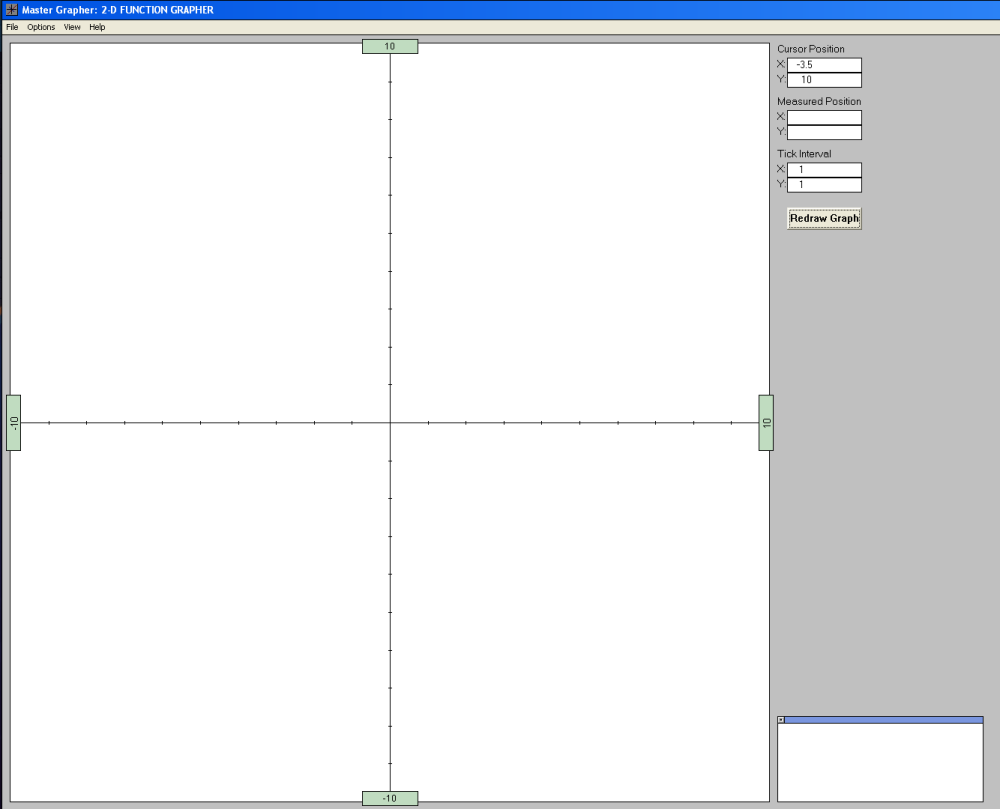
The user interface screen of Master Grapher for Windows
A thirty-year-old PC was restarted to read a thirty-year-old floppy disk (“stiffy”). It worked. Master Grapher now runs under Windows XP in a virtual machine on my main desktop. Obsolescence, it seems, is sometimes more a matter of opinion than fact.
As a language for defining functions, I adopted a syntax similar to that used in programming languages such as BASIC. This style is also familiar from spreadsheets, allowing students to learn a notation that might be useful beyond this program. The standard arithmetic operators were supported, along with the caret symbol (^) to denote exponentiation. In addition to the usual mathematical functions, the identifiers e and pi were recognised as special constants, and both ln and log were accepted.
The parser would first scan for the variable x, then resolve brackets, followed by operators and functions, building an internal array that defined the order in which calculations would be performed for each x-value plotted on the graph.
It became clear early on that some of the object-oriented features of C++ would be useful. Although I was never particularly fond of the language or its conceptual overhead, I adopted it where it made sense, using it primarily in the development of the syntax parser. This was a pragmatic decision rather than an ideological one: it was simply the most workable way forward
A comment from a friend at Borland has stayed with me: with object-oriented programming, you often just want the banana, but instead you get the whole gorilla...
A standard Windows input box was used for entering functions, with a pop-up dialog reporting any errors that the parser could identify. Where possible, the cursor was placed at the point in the input where the error was detected. To simplify parsing and reduce overhead, all input was converted to lowercase as it was entered.
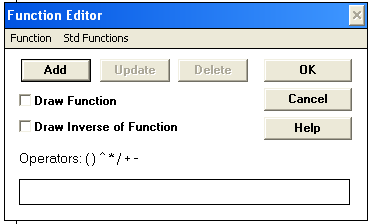
The function editor
We strongly encouraged students to use brackets to resolve ambiguities, especially in problems involving division and exponentiation. With single line functions, the parser has no inherent way of knowing where, for instance, an exponent ends.This kind of ambiguity has given rise to many heated arguments on the web over what would be a non-problem with the correct use of brackets. For example, is the expression 6 ÷ 2(1 + 2) actually (6 ÷ 2)(1 + 2) or 6 ÷ (2(1 + 2))? The additional brackets would remove the ambiguity - and, with it, the argument.
Drawing graphs on a monitor was already familiar territory, so all that was needed was a way to handle the exceptions caused by discontinuities in the function. The algorithm was based on two ideas: the graph viewport was traversed in pixel positions along the x-direction and mapped to x-coordinates on the graph, and drawing itself operated in two states, pen-up and pen-down. This made plotting the function relatively straightforward. If the function value (y) was valid within the viewport for an x value, the pen state was set to down. If the pen state was already down, a line was drawn from the previous coordinate to the current one. In this way, discontinuities were handled cleanly, and misleading lines across asymptotes were avoided.
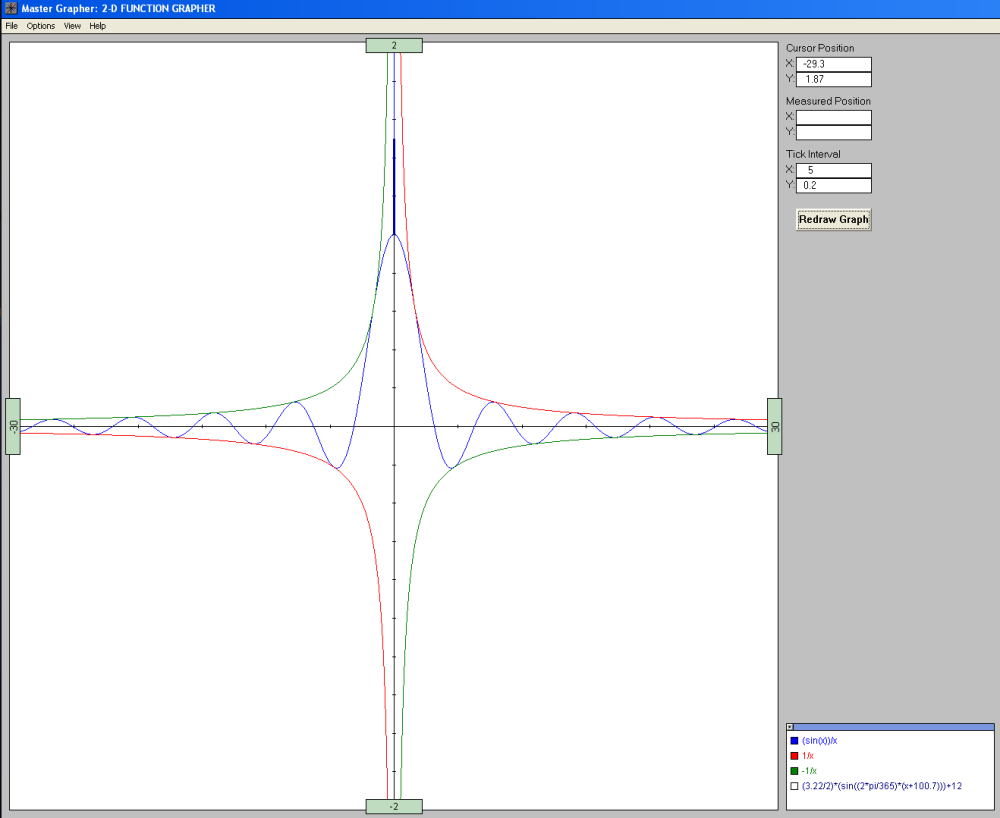
Three functions drawn with Master Grapher for Windows
The following graph illustrates the daylight hours for the city of Pretoria over the course of a year. The daylight hours can be modelled by the function:
where
- D(t) represents the daylight hours
- K is a constant depending on the latitude (3.22 for Pretoria)
- t is the day number of the year (with 0 being the first of January)
To input this function, the student had to recognise that the independent variable t played the role of x in the grapher.
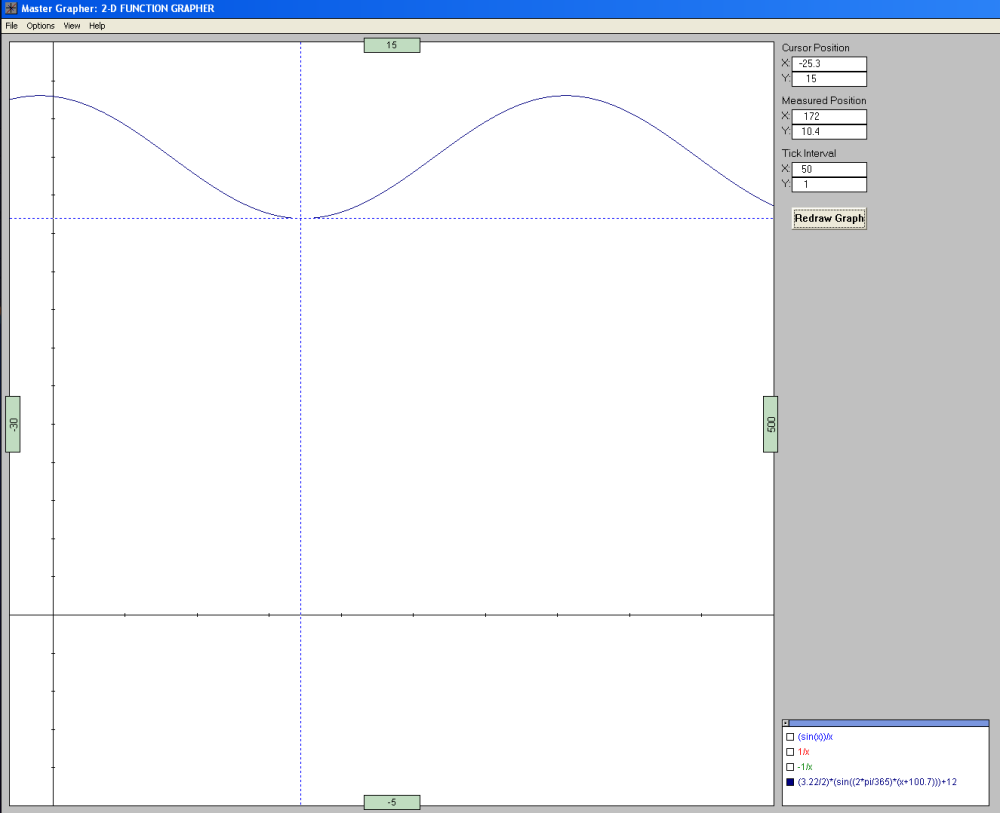
A graph showing that the independent variable need not be x
Several features of the grapher are illustrated in the graphs above:
- The functions in the previous graph remain present, but have been switched off.
- The hatched lines show the daylight hours at the winter solstice in Pretoria - in this case 10.4 hours. This point is obtained by right clicking in the grapher's viewport.
(23 January 2026)
Some reflections
- Steyn (1998) did a great deal of work with Master Grapher for Windows, and published several papers on her experiences with students using the grapher. She notes in her thesis that more than 20,000 student hours were spent using the software in the two years after it became available.
- A companion handbook (Greybe, Steyn and Carr, 1998) accompanied the software and guided students through problems from precalculus to early calculus.
- The grapher survived several Windows upgrades and was still in use up until 2004, with Windows XP. Staff from the Mathematics Department then felt that the grapher was beginning to look dated, and were wanting to move over to software such as Matlab. My feeling was that Matlab was a bit too advanced for the students we were involved with.
- Remarkably little debugging was required once the grapher went live. Given the complexity of the parser and drawing routines, this remains one of the more satisfying aspects of the project.
- Internally, the use of the standard
pow()function placed some limits on numerical behaviour at the extremes, though these lay well outside anything encountered by students. - In addition to the grapher itself, three tutorial programs were developed, each using the same parser and graph-drawing routines as the grapher, via a shared library. This allowed concepts to be introduced progressively while relying on a common computational core.
- The grapher included a Windows help file with linked topics. Constructing this proved to be a substantial task in its own right, particularly given the limited documentation at the time.
- The grapher was also used as part of a research project involving postgraduate students at the Faculty of Education from 2002 to 2005.
I would like to thank Tobia Steyn, the teacher who recognised why the project mattered. Her insistence that the software serve the students rather than the elegance of the code did much to keep the project on track.
(24 January 2026)
References
- Demana, F., Waits, B.K. and Clemens, S.R. (1993). Precalculus Mathematics: A graphing approach. Addison-Wesley.
- Greybe, W.G., Steyn, T.M. and Carr, B.A. (1998). Fundamentals of 2-D Function Graphing - A practical workbook for precalculus and introductory calculus. Oxford University Press, Cape Town.
- Petzold, C. (1992). Programming Windows 3.1. Microsoft Press, Redmond.
- Steyn, T.M. (1998). Graphical exploration as an aid to mastering fundamental mathematical concepts: An instructional model for mathematics practicals. (M.Ed. thesis). University of Pretoria.
- Waits, B.K., Demana, F. and New, D.B. (1989). Master grapher and 3D grapher. Addison-Wesley.
Endnote Later parts of the project made use of additional tools and languages, which are beyond the scope of this article.
Back to the Accidental Programmer
