Rainfall
I have been recording rainfall in my suburb since 2015. I share it here for no reason whatsoever.
The rainfall is recorded before 0800 each morning. This means rain which falls on the last day of a month is recorded under the first day of the next month.
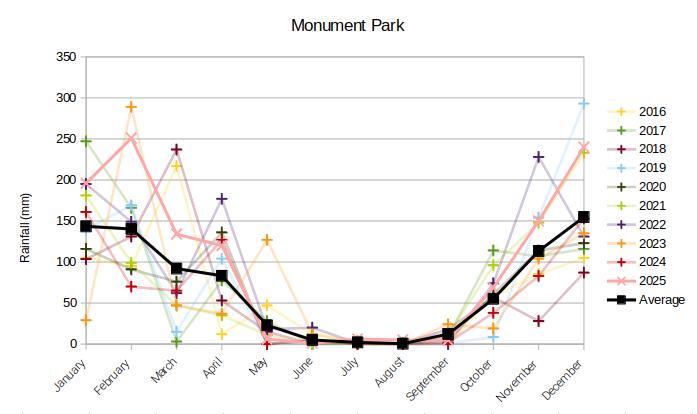
Rainfall graph
The graph shows the average rainfall since 2015 as well as the monthly rainfall for the preceding ten years. Values for 2026 have not yet been included in calculating the average line.
The following table shows the data used in drawing the graph.
Table 1. Monthly rainfall in mm
| Jan | Feb | Mar | Apr | May | Jun | Jul | Aug | Sep | Oct | Nov | Dec | Total |
| 2015 | 104 | 33 | 109 | 37 | 0 | 1 | 9 | 0 | 58 | 12 | 46 | 87 | 496 |
| 2016 | 105 | 95 | 217 | 12 | 47 | 12 | 0 | 0 | 0 | 58.5 | 85.5 | 105 | 737 |
| 2017 | 247 | 166 | 3 | 77.5 | 28 | 0 | 1.5 | 0 | 9 | 114 | 107 | 116 | 869 |
| 2018 | 103.5 | 131 | 237 | 53 | 15 | 0 | 1 | 1 | 18 | 57 | 28 | 87 | 731.5 |
| 2019 | 140 | 169 | 15 | 104 | 0 | 0 | 0 | 0 | 1 | 8.5 | 154 | 293 | 884.5 |
| 2020 | 116 | 91 | 76 | 136 | 0 | 4 | 0 | 0 | 5 | 61 | 114 | 123 | 726 |
| 2021 | 181 | 99 | 47 | 35 | 11 | 0 | 0 | 0 | 12 | 96 | 148 | 233 | 862 |
| 2022 | 195 | 149 | 62 | 177 | 18 | 20 | 1 | 0 | 0 | 74 | 228 | 131 | 1055 |
| 2023 | 29 | 289 | 47 | 37 | 127 | 12 | 4 | 0 | 24 | 19 | 104 | 135 | 827 |
| 2024 | 162 | 70 | 65 | 127 | 0 | 5 | 0 | 0 | 2 | 38 | 83 | 153 | 704 |
| 2025 | 196 | 251 | 134 | 120 | 6 | 1 | 6 | 5 | 5 | 69 | 150 | 240 | 1183 |
| 2026 | 60 | 69 | 137 | 101 | 43 | 4 | | | | | | | 414 |
| Av | 143.4 | 140.3 | 92.0 | 83.2 | 22.9 | 5.0 | 2.0 | 0.5 | 12.2 | 55.2 | 113.4 | 154.8 | 825.0 |
The readings for 2026 have not yet been included in the averages.
(updated: 2 March 2026)
Temperature
I extended my weather measurements by recording weekly maximum and minimum temperatures at the beginning of 2025. For this I used a TFA Maxima-Minima Thermometer.
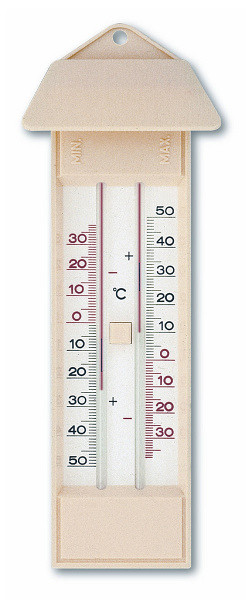
TFA Maxima-Minima Thermometer
I had previously used this thermometer to measure ambient temperature highs and lows in the vicinity of my fermenter while brewing. Unfortunately, the alcohol in this thermometer separated very easily. The slightest bump would cause air gaps in the alcohol column, and the maximum or minimum markers would then become blocked by these gaps, rendering the max/min capability useless.
These air gaps could be removed by moving the maximum and minimum markers towards the top of the housing with a magnet and then vigorously flicking the thermometer. This took a lot of effort and often resulted in rather painful wrists and forearms.
I then decided to use the thermometer for its intended purpose and mounted it in a semi-shetered spot outside to measure weekly highs and lows. Unfortunately, becuase of the design of the thermometer, when the wind was in the right direction it allowed the instrument to vibrate, again causing air gaps in the alcohol column.
Eventually, I ended up with a tiny air gap, which no amount of flicking would remove, and this caused the minimum marker to jam permanently. I therefore started looking for a digital thermometer.
Unfortunately, most digital thermometers are intended for indoor use only. Some models have an outdoor probe, but these require a wired link between the probe outside and the display inside. I eventually found a thermometer on Temu which does exactly what I was looking for.
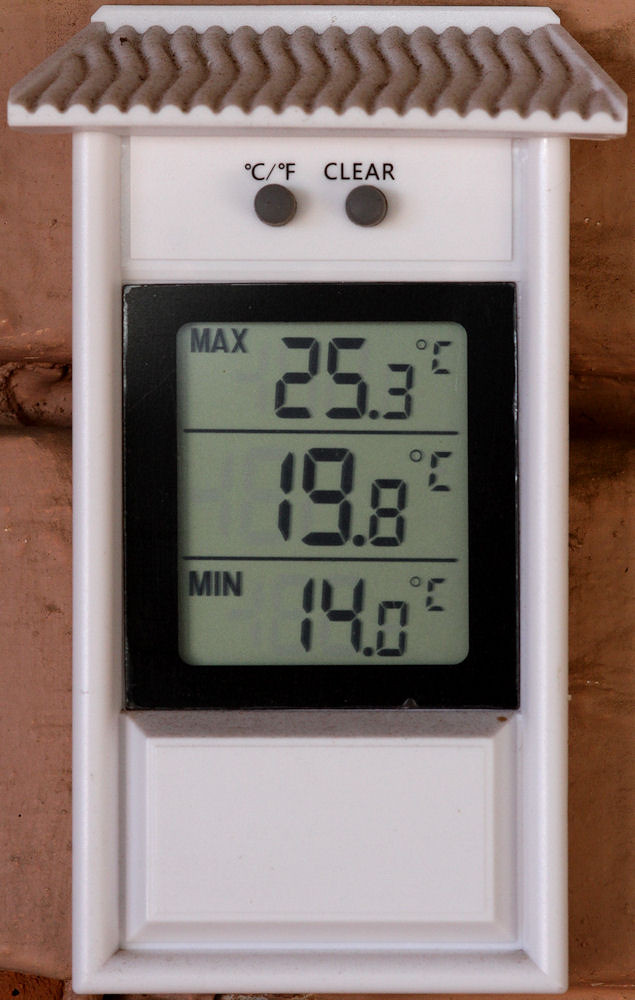
Digital maximum and minimum thermometer
The readings on this thermometer corresponded well with an alcohol thermometer which had previously been checked against a reference thermometer.
The table below shows the readings taken to date. The gap for July and August 2025 is when the TFA thermometer failed.
Table 2. Average monthly maximum and minimum temperatures in °C
|
Jan |
Feb |
Mar |
Apr |
May |
Jun |
Jul |
Aug |
Sep |
Oct |
Nov |
Dec |
|
Max | Min |
Max | Min |
Max | Min |
Max | Min |
Max | Min |
Max | Min |
Max | Min |
Max | Min |
Max | Min |
Max | Min |
Max | Min |
Max | Min |
| 2025 |
29.7 | 17.3 |
29.3 | 16.8 |
27.8 | 15.5 |
25.3 | 11.8 |
20.0 | 9.0 |
17.6 | 5.4 |
| |
| |
28.4 | 14.9 |
30.6 | 13.9 |
29.9 | 14.4 |
29.7 | 16.9 |
| 2026 |
31.8 | 17.5 |
32.5 | 17.0 |
28.7 | 16.6 |
26.0 | 14.9 |
21.5 | 10.0 |
19.3 | 8.8 |
| |
| |
| |
| |
| |
| |
Weekly maximum and minimum temperatures are recorded on Mondays at around 0800.
(updated: 19 March 2026)