Games
Catan: Dice or Event Cards?
The Event Cards
With the introduction of the Event Cards in the Catan expansion packs, new features were brought into the game. One of these was the option to use an Event Card instead of the dice to determine which hex would produce resources.
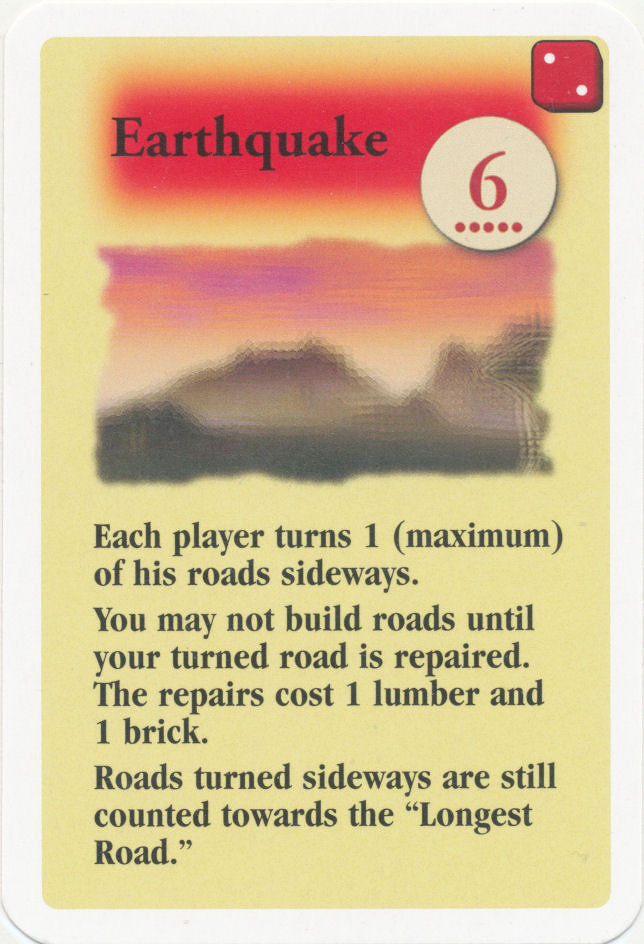
An Event Card
The number in the brown circle, shown at the top right of the card, represents the tally of the dice roll. The numbers from 2 to 12 are distributed according to the statistical probability of each tally occurring when two dice are rolled.
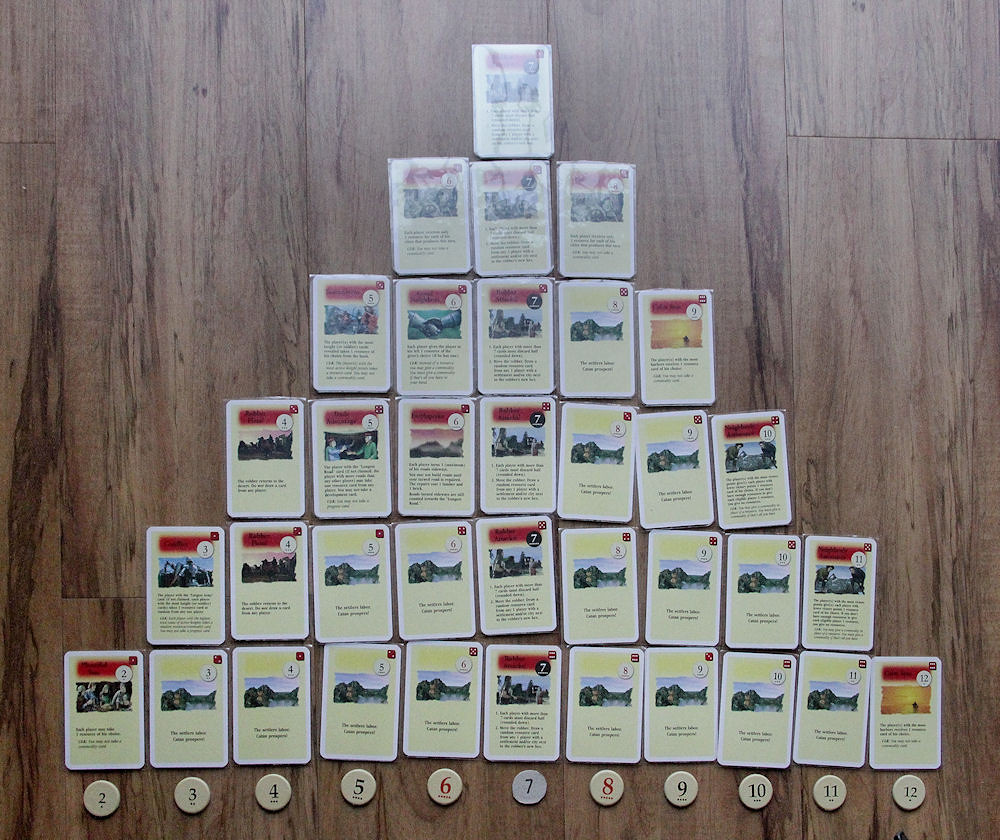
Showing the distribution of the numbers on the Event Cards
This is a good idea in that it matches the chance of a number occurring to the dots on the number tokens representing the resources on the hexes. A player can thus see at a glance which number token, and therefore which hex resource, has the greater probability of occurring.
Unfortunately, while this distribution is statistically correct, it is highly artificial in a game with a relatively small number of turns.
Dice Statistics
The following table shows the percentage of dice rolls resulting in each tally during six games of Catan: Fishermen and Prospectors.
The results can then be compared with the theoretical probability shown in the Stat column.
| Tally | Stat | G1 (3) | G2 (2) | G3 (3) | G4 (3) | G5 (3) | G6 (2) | Tot |
|---|---|---|---|---|---|---|---|---|
| 2 | 2.7 | 7.9 | 0 | 0 | 0 | 3.8 | 5.7 | 3.03 |
| 3 | 5.6 | 7.9 | 10.0 | 8.3 | 2.9 | 0 | 2.9 | 5.56 |
| 4 | 8.3 | 7.9 | 7.5 | 4.2 | 5.7 | 11.5 | 5.7 | 7.07 |
| 5 | 11.1 | 15.8 | 7.5 | 8.3 | 8.6 | 23.0 | 5.7 | 11.11 |
| 6 | 13.9 | 2.6 | 15.0 | 16.7 | 17.1 | 23.0 | 14.3 | 14.14 |
| 7 | 16.7 | 21.1 | 20.0 | 16.7 | 20.0 | 15.4 | 20.0 | 19.19 |
| 8 | 13.9 | 13.2 | 12.5 | 12.5 | 11.4 | 11.5 | 11.4 | 12.12 |
| 9 | 11.1 | 15.8 | 5.0 | 25.0 | 14.3 | 3.8 | 14.3 | 12.63 |
| 10 | 8.3 | 2.6 | 10.0 | 4.2 | 11.4 | 3.8 | 14.3 | 8.08 |
| 11 | 5.6 | 5.3 | 5.0 | 4.2 | 5.7 | 3.8 | 0 | 4.04 |
| 12 | 2.7 | 0 | 7.5 | 0 | 2.9 | 0 | 5.7 | 3.03 |
| T | 38 | 40 | 24 | 35 | 26 | 35 | 198 |
Understanding the table
- Tally: spot count of two dice
- Stat: the statistical chance of the tally occurring
- Gx (n): Game number x, with n players
- Tot: percentage of all occurrences of a tally across the six games, not an average of the individual game percentages
- T: number of dice rolls in the game
Comments
As the table shows, the relatively small number of turns in an individual game means that none of the games reproduces the statistical distribution shown in the Stat column particularly well. Individual tallies can be considerably higher or lower than their expected frequency.
When the results from all six games are combined, however, the almost 200 dice rolls produce a distribution much closer to the expected values. The larger the number of rolls, the more the observed results tend towards the statistical distribution.
The distribution imposed by the numbers on the event cards is therefore highly artificial. Even allowing for the New Year card, which prevents some numbers from being played, the cards remove much of the natural variation produced by rolling two dice. To introduce more chance into the game, I recommend using dice instead of the event cards.
(16 August 2026)
